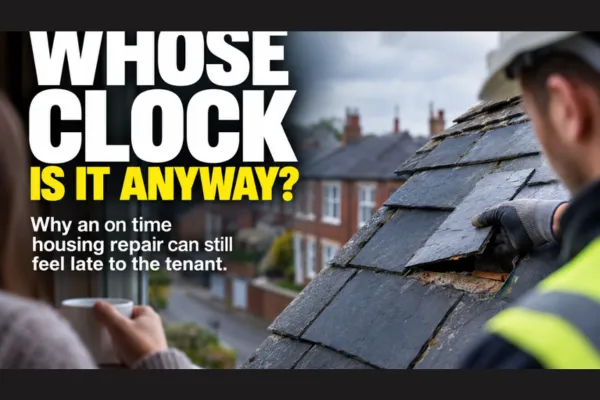
WHOSE CLOCK IS IT ANYWAY?
There is something rather odd hiding in the housing repairs data.
58% of tenants aren’t satisfied with how long it takes to complete their repair.
The obvious answer is to do repairs faster. And that’s pretty much what we’ve tried to do. We set targets, measure completion times, publish first time fix rates and produce dashboards showing whether repairs were completed on time.
Except we’ve found a problem.
Our analysis of the regulatory evidence across hundreds of landlords suggests that whether a repair is completed within target has only a relatively weak relationship with overall tenant satisfaction.
Measures describing what the tenant actually experienced appear much more strongly associated with satisfaction: whether the landlord listened and acted, whether they were treated fairly and respectfully and, crucially, whether they were satisfied with how long things actually took.
Which raises an awkward question.
Whose clock have we been measuring?
A SLATE DIFFERENCE
Imagine a tenant reports a problem with their roof.
Someone attends. Fixes it. Job closed.
Two months later, the tenant calls again. Another problem with the roof.
Someone attends. Fixes it. Job closed.
Two months later...
Roof problem.
Now it gets interesting.
The contractor might quite reasonably say the second repair had nothing to do with the first. Different slate. Different job.
The computer may agree.
Three repairs. Three completions. Perhaps all three completed within target.
Lovely dashboard.
The tenant, meanwhile, thinks they’ve had a problem with their roof for six months.
So who’s right?
Possibly both.
And that’s the clue.
FOLLOW THE DEMAND
Perhaps we’ve been asking the wrong question.
Instead of only asking whether each repair was completed within target, we should also ask:
Where does the demand keep coming back?
Which properties contact us repeatedly? About what? How frequently? How quickly after the previous intervention? Which repair types recur? Which households repeatedly chase? Which components, estates, contractors or property types appear unusually often?
We won’t know from the data alone whether every repeat contact represents the same underlying problem.
We don’t need to.
The pattern tells us where to look.
Then we follow the cases and find out what’s actually happening.
This is the bit I think housing repairs has been missing.
Type and frequency of demand.
SOMEONE HAS TO DO THE WORK
Every time demand comes back, somebody has to do more work.
The tenant calls again, explains again, waits again, arranges access again and perhaps chases again.
The landlord takes another call, diagnoses another problem, raises another job and manages another case.
The contractor sends somebody out again.
We call some of that customer effort.
The interesting thing is that we’re still not particularly good at measuring it.
Of course we should try to solve as much demand as possible first time. But first time fix will never be perfect. Roofs will leak again. Parts will fail. Diagnoses will occasionally be wrong. Sometimes the second repair genuinely will be another slate.
So what happens to the tenant when it isn’t fixed first time?
That’s just as important.
Because until we can eliminate the repeat demand, it is the landlord’s job to make that repeat demand as easy as possible to deal with.
The tenant shouldn’t have to remember who they spoke to, explain the whole story again, work out who’s responsible, chase the contractor or start from the beginning because the computer thinks this is a new job.
If we can’t remove the problem yet, we can at least remove some of the work involved in living with it.
WHEN A REPAIR STOPS BEING A REPAIR
There’s another reason this matters.
Suppose one property repeatedly generates roofing demand.
Or one estate keeps producing the same plumbing failures.
Or a particular property type produces damp and mould cases year after year.
At what point does that stop being repairs data?
At some point, it becomes investment intelligence.
Because type and frequency of demand can show the capital works team where repeatedly fixing individual jobs may make less sense than fixing the underlying asset.
That’s quite a shift.
The same information can now do three things.
It can show operations where problems keep coming back.
It can show customer teams where tenants are having to work too hard.
And it can show asset teams where tomorrow’s investment might remove today’s demand altogether.
THIS ISN’T REALLY ABOUT ROOFS
There is a bigger idea hiding in all of this.
Housing repairs happens to make it particularly easy to see because the physical problem keeps coming back. But organisations everywhere tend to measure transactions rather than study the type and frequency of the demand those transactions create.
A claims team can settle a case within target while the customer has called six times to find out what’s happening.
A pensions administrator can answer five separate enquiries without noticing they’re all symptoms of the same unresolved problem.
A contact centre can hit its handling time target while the same customer keeps coming back.
Each transaction can look successful.
The system can be hitting its targets while the customer is repeatedly returning with the same underlying need.
And that’s why type and frequency matters far beyond housing repairs.
Instead of beginning with How quickly did we process the work?, start with:
What are people asking us for? How often? Where does the same demand keep returning? And what does that pattern tell us about the problem underneath?
Because recurring demand isn’t merely a customer service problem.
It is information.
Information about where customers are struggling. Where employees are doing unnecessary work. Where processes are failing. Where products or assets may need redesigning. And where investment might remove demand rather than simply process it faster.
Perhaps that’s the larger lesson.
Don’t just count the work. Study why the work keeps arriving.
THE OTHER CLOCK
Which brings us back to the 58%.
Perhaps the answer isn’t simply another target for completing repairs faster.
Perhaps we need to understand the type and frequency of the demand we’re dealing with, find the patterns inside it and investigate why those patterns exist.
Keep the existing measures where they’re useful.
But add another lens.
Your dashboard tells you how the jobs performed.
Your demand may tell you whether you solved the problem.
And if we can see where the demand keeps coming back, we might discover something rather more useful than another first time fix percentage.
We might find the problems worth solving.
And perhaps the investments worth making.
THE QUESTION
Do your repairs measures tell you where demand keeps coming back and how much work you’re leaving the tenant to do when it does?